Time
and again, the need to take a plunge under the hood of your running application
arises. The reasons driving this can range from a slow service, JVM crashes,
hangs, deadlocks, frequent JVM pauses, sudden or persistent high CPU usage or
even the dreaded OutOfMemoryError (OOME). The good news is that there exist
many tools you can use to extract various bits of preliminary information from
your running JVM, allowing you to get that “under the hood” view you need to
diagnose such situations.
In this
article I will be going through some of the open source tools that are
available. Some of these tools come with the JVM itself, while some are third
party tools. I will start out with the simplest of the tools, and gradually
move on to more sophisticated tools as the article progresses. The main
objective is to enable you to extend your diagnostic toolbox, something that
will most definitely come in handy when you application starts to perform
strange, slow or not at all.
So, let’s
get started.
If your application is experiencing unusually high memory
load, frequent freezes or OOME, its often most useful to start by understanding
just what kind of objects are present in memory. Luckily the JVM comes
out-of-the-box with the ability to do so, with the built-in tool ‘jmap’.
Jmap (with a little help from JPM)
Oracle describes jmap as an application that “prints shared
object memory maps or heap memory details of a given process or core file or
remote debug server”. In this article we will use jmap to print out a
memory-histogram.
In order to run jmap,
you need to know the PID of the application that you want to run jmap against.
One easy way to obtain this is to use the JVM-provided tool jps,
which will list out each and every JVM process running on your machine, along
with each process’ PID. The output of jps will look like the following:
following:
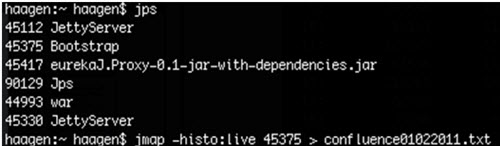
Figure 1: Terminal
output of the jps command
To print
out a memory histogram, we will invoke the jmap console app passing in our
application’s PID and the “-histo:live” option . Without this option, jmap will
make a complete dump of the application’s heap memory (which is not what we are
after in this scenario). So, if we wanted to retrieve a memory histogram for
the “eureka.Proxy” application from the figure above, we invoke jmap as:
jmap
–histo:live 45417
The output
of the above command might look something like the following:
(Click on
the image to enlarge it)

Figure 2:Output of the jmap -histo:live command, showing live
object counts from the heap
The
resulting report shows us a row for each class type currently on the heap, with
their count of allocated instances and total bytes consumed.
For this example I had let a colleague deliberately add a rather
large memory leak to the application. Take specific note on the class at line
8, CelleData, compared to the
snapshot below, taken just 4 minutes later:
(Click on
the image to enlarge it)

Figure 3: jmap output showing the increased
object count for the CelleDataclass
Note that the CelleData class
now has become the second-largest class in the system, having added 631,701
additional instances in those 4 minutes. When we fast forward another hour or
so, we observe the following:
(Click on
the image to enlarge it)

Figure 4: jmap output an hour after application
startup, showing over 25 million instances of the CelleData class
There are now more than 25 million instances of the CelleData class, occupying over 1GB of
memory! We’ve identified a leak.
What’s nice
about this data is that it’s not only useful, but also very quick to get hold
of, even for very large JVM heaps. I’ve tried it with a busy application using
17GB of Heap memory and jmap was able to produced its histogram in about one
minute.
Note that jmap isn’t a profiling tool, and that the JVM might
halt during the histogram generation, so be sure its acceptable for your
application to pause for the time it takes to generate the histogram. In my
experience though, generating a histogram is something you do more often when
debugging a serious bug, and so a few one minute pauses of the application is
likely acceptable during such circumstances. This brings me nicely along to the
next topic – the semi-automatic profiling tool VisualVM.
VisualVM
Another tool currently built into the JVM is VisualVM, described by its creators as “a
visual tool integrating several command line JDK tools and lightweight
profiling capabilities”. As such, VisualVM is another tool that you are most
likely to fire up post-mortem, or at least after a serious error or performance
issue has been identified through more traditional means (customer complaints
being the most prominent in this category).
We’ll
continue with the previous example application and its serious memory leak
problem. After about 30 minutes of operation VisualVM has built up the
following chart:
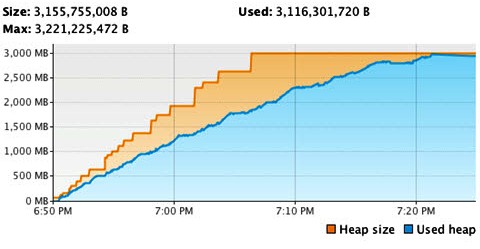
Figure 5: VisualVM memory chart of the initial
application run
With this
graph we can clearly see that by 7:00pm, after only 10 minutes of operation,
the application is already consuming over 1GB of Heap space. After another 23
minutes the JVM had reached the ceiling of its –Xmx3g threshold, resulting in a
very slow application, a slow system (constant Garbage Collection) and an
incredible abundance of OOME.
Having
identified the cause of this climb with jmap, then fixing it, we give the
application another run under the strict supervision of VisualVM and observe
the following:
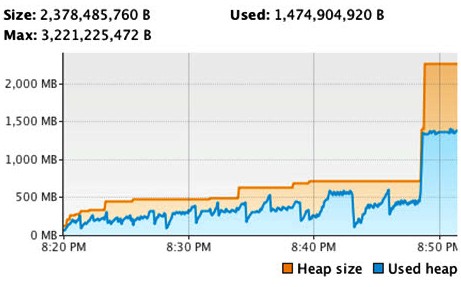
Figure 6: VisualVM memory chart after fixing the
memory leak
As you can
see, the memory curve of the application (still having been launched with
–Xmx3g) looks much, much better.
In addition to the memory graphing tool, VisualVM also provides
a samplerand a lightweight profiler.
The
VisualVM Sampler lets you sample your application periodically for CPU and
Memory usage. It’s possible to get statistics similar to those available
through jmap, with the additional capability to sample your method calls’ CPU
usage. This enables you to get a quick overview of your methods execution
times, sampled at regular intervals:
(Click on
the image to enlarge it)

Figure 7: VisualVM method execution time table
The
VisualVM Profiler will give you the same information as the sampler, but rather
than sampling your application for information at regular intervals, it can
gather statistics from your application throughout normal application execution
(via byte-code instrumentation of your application’s source). The statistics
you’ll get from this profiler will be more accurate and more frequently updated
than the data gathered by the sampler.
(Click on
the image to enlarge it)

Figure 8: Output from
the VisualVM Profiler
The
flipside you must consider though is that the profiler is a “brute-force”
profiler of sorts. It’s instrumentation approach will essentially redefine most
of the classes and methods that your application is executing, and as a result
is likely to slow down your application significantly. For example, running
part of a normal analysis with the application used above, the application
finished in about 35 seconds. Turning on VisualVMs memory profiler caused the
application to finish the same analysis in 31 minutes.
Understand that VisualVM is not a full-featured profiler, as its
not capable of constantly running against your production JVM. It won’t persist
its data, nor will it be able to specify thresholds and send alerts when these
thresholds are breached. To be able to get closer to the goal of a
full-featured profiler, let’s look next at BTrace,
a full-featured open source Java agent.
BTrace
Imagine
being able to tell your live production JVM exactly what type of information
you want to gather (and as result what to ignore). What would that list look
like? I suppose the answer to that question will differ from person to person,
and from scenario to scenario. Personally, I am frequently most interested in
the following statistics:
·
The Memory usage for the applications Heap, Non Heap, Permanent
Generation and the different memory pools that the JVM has (new generation,
tenured generation, survivor space, etc.)
·
The number of threads that are currently active within your
application, along with a drilldown of what type of threads that are in use
(with individual counts)
·
The JVMs CPU load
·
The Systems load average / Total CPU usage of the system
·
For certain classes and methods in my application I want to see
the invocation counts, the average self execution time and the average wall
clock time.
·
The invocation counts and the execution times for SQL calls
·
The invocation counts and the execution times for disk and network
operations
BTrace can
gather all of the above information, and it lets you specify just what you want
to gather using BTrace Scripts. The nice thing about BTrace script is that it
is just a normal Java class containing some special annotations to specify just
where and how BTrace will instrument your application. BTrace Scripts are
compiled into standard .class files by the BTrace Compiler - btracec.
A BTrace script consists of multiple parts, as shown in the
diagram below. For a more thorough walkthrough of the script shown below,
please the BTrace
project’s website.
As BTrace is only an agent, its job is finished when it has
logged its results. BTrace doesn’t have any functionality to dynamically
present you with the information it has gathered in any other form than a
textual output. By default the output of a BTrace script will end up in a text
file alongside the btrace .class file, called YourBTraceScriptName.class.btrace.
Its possible to pass in an extra parameter to BTrace to make it
log-rotate its log files at specified intervals. Keep in mind that it will only
log rotate across 100 files, after reaching *.class.btrace.99 it will overwrite
the *.class.btrace.00 file. If you keep your rotation intervals to a sensible
amount (say, every 7.5 seconds) that should give you plenty of time to process
the output. To enable this log rotation, add the fileRollMilliseconds=7500parameter
to the java agents input parameters.
A big downside of BTrace is its primitive, difficult to navigate
output format. You’ll really want a better way to process the BTrace output and
data, preferably in a consistent graphical user interface. You’ll also benefit
from the ability to compare data from different points in time, as well as the
ability to send alerts when thresholds are breached. This is where the new open
source tool EurekaJ comes in.
(Click on
the image to enlarge it)

Figure 9: The required
parts of a BTrace script to
enable method profiling
Mind the performance hits – keep your cold spots cold!
Each
measurement that you gather is likely to incur a performance hit on your system
in some way. Some metrics can be considered “free” (or “ignorably cheap”),
while others can be quite expensive to gather. It is very important that you
know what you are asking of BTrace, so that you will minimize the performance
hit profiling will cause your application. Consider the following three
principles regarding this:
·
“Sample”-based measurements can generally be considered “free”. If
you sample your CPU load, process CPU load, Memory Usage and Thread count once
every 5-10 seconds, the added millisecond or two incurred is negligible. In my
opinion, you should always gather statistics for these types of metrics, being
they cost you nothing.
·
Measurements of long-running tasks can also be considered “free”.
Generally, you will incur 1700-2500 nanoseconds for each method being profiled.
If you are measuring the execution times of SQL-queries, network traffic, disk
access or the processing being done in a Servlet where one might expect a
performance ranging from 40 milliseconds (disc access) to up to a second
(servlet processing), adding about 2500 nanoseconds to each of these methods is
also negligible.
·
Never add measurements for methods that are executed within a loop
As a
general rule you want to find your application’s hot spots, while being mindful
to keep your cold spots cold. For example, consider the following class:
(Click on
the image to enlarge it)

Figure 16: Example of a simple Data Access Object
class that we might want to profile
Depending on the execution time of the SQL defined on line 5,
the readStatFromDatabase method
could be a hot-spot. It will become a hot-spot if the query returns a
significant amount of rows, having a negative effect both at line 13 (network
traffic between the application and the database server) and at lines 14-16
(the processing required for each row in the resultset). The method will also
become a hot spot (at line 13) if it takes the database a long time to return
the results
The method buildNewStat however will likely never become a
hot spot, in and of itself. Even though it might be executed many times, it
will complete in just a couple of nanoseconds for each invocation. On the other
hand, adding a 2500 nanosecond metric-gathering hit for each invocation will
most definitely make this method look like a hot spot, whenever the SQL is
executed. Therefore we want to avoid measuring it.
(Click on
the image to enlarge it)

Figure 17: Showing
which parts of the above class to profile and which to avoid
Summary
Throughout
this article we’ve gone over the strength of some of the open source tools that
are available for use both when you need to perform a deep-dive analysis into a
running JVM, as well as when the time comes to employ a wider and continuous
surveillance of your development/test/production application deployments using
a profiler tool.
Hopefully
you have started to see the benefits of continuously gathering metrics, and the
ability to be alerted whenever your defined thresholds that you set for your
application is breached.
Thank you!
