by Rob Hinds · Feb 27, 21 · Web Dev Zone · Tutorial
Google's Structured Data Schema helps you be a better web citizen as well as bringing SEO benefits, and if you have a dynamic web app, should be easy to implement.
As a result of working in web products (both personal and professional), I have become quite au fait with SEO from a technical point of view, and the purely technical things you can do to put you in good standing - all of which really, are just web best practices to be a good web citizen - things that we should be doing to make the web better (proper use of HTTP headers, mobile friendly designs, good performance for people on slower connections, etc.).
One thing that is a bit above and beyond that is the use of Google's Structured Data. I will talk about what it is and what it does below, but if you are dynamically loading webpages (e.g. your website isn't just HTML on a web server, but either served from a server-side application, or is an API driven JS application), then you are most likely well placed to easily and immediately start implementing it.
1. What Is Structured Data?
Google has defined a set of schemas regarding Structured Data on websites. This is a schema that allows better definition of key data points from a given website. It's a sensible move by Google and is a natural progression for their search engine.
Think about it, there are millions of websites out there made up with sprawling HTML code and content - whilst HTML is a standard (more or less!) across the web, there are probably millions of different ways people use it. It would be nice if everyone used the H1 etc heading tags consistently, or if everyone used the <em> tag the same way (emphasis vs italics), but the reality is they don't - some sites will be using HTML as intended but many many more undoubtedly just rely on <span> or <div> tags combined with CSS classes to re-define every element they might need.
This is all fine, Google is smart enough to pull out the content for indexing - yes, if you use span elements with custom styling for headings on your website rather than the H1+ tags then Google will penalise you, but it won't stop Google reading and indexing the site. What's more, its getting smarter all the time - I'd probably back Google to be able to pull out relevant clips or question/answers directly in a fairly reliable way. However, they are Google and much like the Microsoft/IE of the 90s, they have the dominant market share so they can define their own standards for the web if they want to. That's exactly what Structured Data is.
It's Google saying:
Hey, if you provide some data in your code that looks like this and is cool with our schema, then we will read that, so we don't have to guess or work out stuff. Or we can just keep trying to work it out from your HTML content.. it's your call
As mentioned earlier, if you have control over the source code and the data on your website, then this is really powerful. You can define specific (keyword heavy) snippets of content and explicitly tell Google about them - what's more the Schema for Structured Data lets you define content such as FAQ or how-to directions - so you can go beyond keyword heavy snippets and actually create FAQ for questions that you have identified from Google search trends (or whatever SEO tools you might use).
Hopefully you get the picture by now - this is a pretty powerful tool.
2. Schema Tags: FAQ and HowTo
Two specific parts of the Structured Data Schema stood out to me as quite universally useful for websites, and also produce decent tangible results: FAQ schema and HowTo schema.
FAQ schema allows high level Q&A points to be provided in the metadata for Google - generally useful as most sites will have some element of their pages that could be presented as FAQ
HowTo schema allows step-by-step how to guides - less widely applicable, but if you have any website that provides how-to guides or anything with instructions this is applicable.
What exactly to these tags do and why do we care? Well, as well as trying to win favour with the all-seeing google search bot, if it gets picked up it also means we get more search real estate and increased accessibility to our content which should also increase the chance of click through conversion.
If you have ever seen search results like this:
These points are being scraped from the site by Google from their schema tags - if you can automate the creation and inclusion of these for your site then you can be in a pretty good position to improve your SEO (still relatively low number of sites implementing these schemas).
3. Automating Your Schema Tags
As I have mentioned a couple of times, and as you have hopefully realised - if you have a dynamic website, you are likely already taking structured data (from your database for example, so reliably structured!) and building HTML pages (either server-side, or data as JSON to a JavaScript app for page creation client side) - but either way, we are starting off with structured data, and the Google Structured Data wants.. you got it, Structured Data! So if you have the content, it really is a generic, simple transform between structured data formats.
Below is some example code - It is based on Jekyll, as that's what my most recent personal project has been, but it's also pretty close to pseudocode, so hopefully you can easily translate it to whatever tech you use:
HTML
1
{% if page.faqSchema %}
2
<scripttype="application/ld+json">
3
{
4
"@context": "https://schema.org",
5
"@type": "FAQPage",
6
"mainEntity": [
7
{% for faq in page.faqSchema %}
8
{
9
"@type": "Question",
10
"name": "{{faq.title}}",
11
"acceptedAnswer": {
12
"@type": "Answer",
13
"text": "{{faq.answer}}"
14
}
15
}
16
{% if forloop.last == false %}
17
,
18
{% endif %}
19
{% endfor %}
20
]
21
}
22
</script>
23
{% endif %}
As you can see, its a simple JSON based data structure and you just fill in the relevant parts of the object with your data.
You can see the full code in my Jekyll food website over on GitHub here - likewise, you can see the end result in action on the website (hosted by GitHub pages, of course) too - the project was a food-science site - covering science and recipes, so a perfect match for FAQ (science pages) and HowTo (recipe pages). For example if you go to a recipe page view the page source, you will see the JSON schema at the top of the page, using the HowTo schema elements laying out resources required and then the steps required, if you compare that data with the actual page you will see the data mirrors each other (this is an important part, Google doesn't like what it thinks looks like "tricks"). Likewise on the Science of humidity in cooking in the page source you will see the JSON schema with FAQ:
4. Conclusion
If you have control of the data being loaded on to the page (a custom site - something like WordPress or another off the shelf platform might make this harder, but at the same time there are undoubtedly lots of plugins that already handle this for you on your given platform which make it even easier!), and are even vaguely interested in increasing organic traffic and search ranking, then I'd recommend implementing this. It's very easy to add (it's also primarily behind the scenes tech - it doesn't impact the visuals or design of the pages its added to) and can only be beneficial.
As with anything trying to improve SEO, its always hard to measure and get concrete details on, but its relatively low cost to add, minimal ongoing maintenance so I think its worth a shot.
If you have had experiences with Google's Structured data, good or bad, then I'd love to hear about it!
COVID-19 is proving to be a turning point in history. The changes introduced by this crisis are extraordinary and fundamentally reshaping our beliefs and behaviors. The immediate short-term measures, policies, and direct experiences are already changing how we work, including a greater emphasis on remote working, digital collaboration, workplace distancing, and support for temporary workers for example.
In the last two decades, we’ve witnessed multiple industry trends — globalization, the rise of the, start-up ecosystem, technological innovations, etc., that transformed ways of life and profoundly shifted business strategies across the industries. We’ve also experienced various methods and frameworks, such as Lean, XP, Agile, etc., that have helped companies optimize, expedite, and transform business outcomes across the industries.
The global growth story had been underpinned by capitalism at the forefront with little or no consideration towards sustainability or without truly understanding the impact on the natural ecosystem. When the majority of organizational goals are focused solely on driving revenue (or profits or margins), market share, or growth with an insatiable appetite to go faster, the toolbox for success can only mirror the language of speed, cost, and low (or no) failure. The long-term impact on mankind is not everyone’s worry if you’re chasing the year-on-year growth.
It’s not about philanthropy, it’s about renewing our value-system to demonstrate how uniquely we can build a long-term sustainable growth model by doing the right thing for our societies and our people.
It’s a new value-system
Now more than ever, business and government have a crucial role to play in protecting people’s health, bolstering the economy, and developing both practical solutions and game-changing innovations. The need for agility has never been greater. Over the long term, though, we know that the delivery of value to shareholders, employees, and society requires growth. And growth requires innovation and resilience as key ingredients. It’s imperative for everyone to balance immediate measures and growth orientation with sustainable agility.
As we continue to grow the Sustainable Agile Community, we have a new home for The Manifesto for Sustainable Agile https://sustainagile.org/
The Manifesto for Sustainable Agile
Over the last 10 years of my career studying sustainable business models, one key differentiator I found between sustainable vs. non-sustainable models is the “value-system” that drives every function of the organization. That provided the much-needed foundation for my thinking around the manifesto for sustainable agile.
The manifesto is an extension to the Agile Manifesto which I hope will help individuals, teams, leaders, and enterprises to navigate these turbulent times and discover a new normal and a better world.
The four core values of Manifesto for Sustainable Agile are:
1. Collocated Minds Over Collocated People
Technology has helped us prove that remote work at such a massive scale is possible. Studies have long proven collocated teams are better at delivery outcomes and gain alignment quickly. The effect of the current situation will fundamentally shift how office spaces and collocation are perceived by individuals and leaders.
In the post-COVID-19 era and beyond, remote working may take a front seat, giving people a commute-free lifestyle combined with technology innovations. We are all learning and experiencing a global movement that shows it is more important to have the power of minds, ideas, and thoughts together and collocated through digital mediums and conferencing innovations. Physical collocation may prove not to be an essential aspect for new normal where everyone will master the art of remote working.
[Update 5/06/2020]: In the last few weeks, we have seen some amazing examples of how companies and institutions have responded quickly towards ensuring a location-agnostic approach to various parts of work and life. Some examples are as below:
In the Philippines, Virtual Courts were launched throughout the country.
Organizations have started to re-imagine their employee journey, customer journey, and overall work experience to suit the new normal.
The list goes on….
2. Collective Outcomes Over Individual Outputs
The urge to measure individual productivity has always been of keen interest for people who are more focused on ROI over impact. It has been a topic of debate for years in the agile community that rather than measuring outputs or utilization, one should measure outcomes. In my experience, outputs/utilization measured in an absolute number of hours or any time unit may have NO direct relation to intellectual outcomes. A higher utilization may also yield depreciation in the form of burn-outs or partial failures due to excessive load/stress on individuals.
When we focus on collective outcomes, it drives collaboration, cooperation, and teamwork. Successful organizations will find it a continuous endeavor and a critical mandate to work as a team (not individuals), leveraging collective strengths to deliver collective outcomes.
[Update 5/06/2020]: A majority of leaders are still focused on remote worker productivity. There are many reports of remote worker productivity, which was also a concern prior to COVID-19 and covered as part of the State of Remote Work 2020 report. It is time we adopt a collective outcome-driven approach towards productivity. As a leader, enabling remote work is one part, while making it sustainable needs more than productivity measures.
3. Speed to Value Over Speed to Market
In these times of stress, going faster isn’t the universal answer. Leaders must focus on anticipation and responsiveness along with the perceived opportunity value. Defining value is hard — leaders should carefully define components that make up the value. The components that create value are different for different companies ranging from competitiveness, risk reduction, compliance or sustainability, or other business drivers. When leaders define and manage priorities in the new era, they also need to consider the greater good of society over the traditional capitalist mindset.
[Update 5/06/2020]: I received a few questions and emails around the Speed to Value part. I found a golden nugget from Bill George (Harvard Business School Professor), explaining the new purpose behind the “Creating Shared Value” aspects of capitalism. It is great to see how the new purpose is shifting towards becoming more inclusive for all different stakeholders (employees, customers, suppliers, communities, and shareholders).
4. Empathy and Trust Over Command and Control
During the current crisis and in the post-crisis era, empathy and trust would define the success of leaders. Without empathy, there is no trust which directly impacts working relationships. Between layoffs, lockdowns, and health worries, everyone is going through a different set of challenges. Leaders who continue to use authority and command to push people in these circumstances may lose respect. A truly nimble mindset that encourages people to be at their best while balancing their essential needs is really critical for now and beyond. A sustainable work culture, driven deeply by empathy and trust, would promote unconditional loyalty.
[Update 5/06/2020]: ‘Empathy and trust’ is one the most popular topics in management and leadership circles during this time. Everyone has a part to a play, throughout the journey. It’s not a one-off action. Some of the resources I found useful are listed here:
The Agile Manifesto (2001) at the time of writing had the primary focus to find better ways of developing software. Over the years, Agile adoption has continued to expand, not only within IT, but also beyond IT, in different organizational functions such as HR, finance, marketing, and so on. The values and principles of Agile remain timeless. However, the application of these values and principles must be revisited.
We’re experiencing an unprecedented reality. As companies and leaders go through discovering and defining the new normal, we need a nimble yet resilient mindset to support different ways of working for everyone — be it software development, business operations, or mission-critical service operations. That’s the promise of the new manifesto.
Universal Applicability
The Manifesto for Sustainable Agile brings inclusiveness for everyone into the new normal. Its application is not limited to any particular domain, function, industry, team, or business model. These core values can be universally applied to any and all of the below compositions:
Domains of Work.
Types of Team Compositions.
Industries.
Technology Functions.
Business Functions.
Business Models.
Individuals.
Contribute to the Manifesto
I believe the best way to get the best possible version of anything is through a series of “inspect and adapt” cycles based on feedback from the community at large. As a true believer of collective outcome over individual utilization, I would like to capture insights and best practices from the global community so that the manifesto can become a living document.
To that end, the Manifesto for Sustainable Agile is open source and is released under the CC4-BY-SA license. Join the Sustainable Agile Community today to support and join the movement for future of work.
Please also comment and reach out to me directly via email or Twitter to provide your input. Let us make this new era a collaborative endeavor.
This manifesto is an attempt to reimagine the intent of agility for everyone with a universal applicability in the new normal.
i.o.cluster, also known as interference open cluster, is a simple Java framework that enables you to launch a distributed database service within your Java application, using JPA-like interface and annotations for structure mapping and data operations. This software inherits its name from the interference project, within which its mechanisms were developed.
i.o.cluster is a open source, pure Java software.
The basic unit of the i.o.cluster service is a node – it can be a standalone running service, or a service running within some Java application.
Each i.o.cluster node has own persistent storage and can considered and used as a local database with the following basic features:
operates with simple objects (POJOs).
uses base JPA annotations (@Table, @Column, @Transient, @Index, @GeneratedValue) for object mapping directly to persistent storage.
supports transactions.
supports SQL queries with READ COMMITTED isolation level.
uses persistent indices for fast access to data and increase performance of SQL joins.
allows flexible management of in-memory data for stable operation of the node in any ratio of storage size/available memory.
Each of the nodes includes several mechanisms that ensure its operation:
core algorithms (supports structured persistent storage, supports indices, custom serialization, heap management, local and distributed sync processes).
SQL and CEP processor.
event transport, which is used to exchange messages between nodes, as well as between a node and a client application.
Nodes can be joined into a cluster, at the cluster level with inter-node interactions, we get the following features:
allows you to insert data and run SQL queries from any node included in the cluster.
support of horizontal scaling SQL queries.
support of transparent cluster-level transactions.
support of complex event processing (CEP) and simple streaming SQL.
i.o.cluster nodes does not require the launch of any additional coordinators.
i.o.cluster implements the most simple data management model, which is based on several standard JPA-like methods of the Session object:
persist() - placing an object in a storage.
find() - find an object by a unique identifier.
execute() - execution of a SQL query.
commit() - committing a transaction.
rollback() - rollback a transaction.
As well, i.o.cluster software includes a remote client that provides the ability to remotely connect to any of the cluster nodes using internal event transport and execute standard JPA-like commands (persist, find, execute, commit, rollback).
Distributed Persistent Model
The interference cluster is a decentralized system. This means that the cluster does not use any coordination nodes; instead, each node follows a set of formal rules of behavior that guarantee the integrity and availability of data within a certain interaction framework.
Within the framework of these rules, all nodes of the interference cluster are equivalent. This means that there is no separation in the master and slave nodes system — changes to user tables can be made from any node. Also, all changes are replicated to all nodes, regardless of which node they were made on.
Talking about transactions, running commit in a local user session automatically ensures that the changed data is visible on all cluster nodes.
To include a node in the cluster, you must specify the full list of cluster nodes (excluding this current one).
Node Configuration Parameters
The minimum number of cluster nodes is 2, and the maximum is 64.
After configuration, we may start all configured nodes as clusters in any order. All nodes will be using specific messages (events) to provide inter-node data consistency and horizontal-scaling queries.
Rules of Distribution
All cluster nodes are equivalent.
All changes on any of the nodes are mapped to other nodes.
If replication is not possible (the node is unavailable or the connection is broken), a persistent change queue is created for this node.
The owner of any data frame is the node on which this frame has been allocated.
The system uses the generation of unique identifiers for entities (@DistributedId) so that the identifier is unique within the cluster and not just within the same node.
Data inserts are performed strictly in local structures, and then replicated changes (update/delete) can be performed only on the node-owner of the data frame with this record.
SQL Horizontal-Scaling Queries
All SQL queries called on any cluster nodes will be automatically distributed among the cluster nodes for parallel processing. Such a decision is made by the node based on the analysis of the volume of tasks (the volume of the query tables is large enough, etc.)
If a node is unavailable during the processing of a request (network fails, service stopped), the task distributed for this node will be automatically rescheduled to another available node.
Complex Event Processing
Interference supports complex event processing using the SELECT STREAM clause in the SQL statement. SELECT STREAM query supports three modes of CEP:
Events are processed as is, without any aggregations.
Events are aggregated by column value with using any of group functions (tumbling window).
Some window aggregates events for every new record (sliding window).
The basic differences between a streaming query and the usual one are as follows:
The execute() method returns a StreamQueue object.
The request is executed asynchronously until StreamQueue.stop() method will be called or until the application terminates.
The StreamQueue.poll() method returns all records previously inserted into the table and according to the WHERE condition (if exist) and continues to return newly added records.
Each StreamQueue.poll() method always returns the next record after the last polled position within the session, so that, provided that the SQL request is stopped and called again within the same session, data retrieve was continued from the last fixed position, in another session data will be retrieved from begin of the table.
Unlike usual, a streaming request does not support transactions and always returns actually inserted rows, regardless of the use of the commit() method in a session inserting data (DIRTY READS).
Especially when money is on the line and time is scarce, human decision making can be very flawed. Trading is one of the fields where erroneous and irrational behavior patterns are especially common. In this article, we’re going to look at the most common cognitive biases and irrational decision making patterns, and how to avoid them.
Being aware of these thinking flaws has two main advantages. Firstly, it helps you avoid them in your own trading, and secondly, it can help you identify and explain seemingly irrational market behaviors caused by these biases.
Most of these so-called cognitive biases were discovered and introduced by the Nobel prize-winning Daniel Kahneman and Amos Tversky.
(1) Gambler’s Fallacy
(2) Winning Streaks
(3) Confirmation Bias
(4) Law of Small Numbers
(5) Survivorship Bias
(6) Correlation does not imply Causation
(7) Hindsight Bias
(8) Recency Bias
(9) Attribution Bias
(10) Sunk Cost Fallacy
(1) Gambler’s Fallacy
The first cognitive bias that I want to talk about is the gambler’s fallacy.
The gambler’s fallacy is incorrectly over or understating the likelihood of an event based on a series of past events. This can be illustrated with a simple example of a coin flip. The probability that a coin will land on heads is 50%. No matter how often you flip a coin, this probability does not change. So even if your coin just landed on heads 10 times in a row, this does not affect the probability of the next coin flip.
As the name implies, the gambler’s fallacy is especially common in gambling. When a roulette wheel ended on red for the past 10 rounds, people prefer betting on black even though the odds of red and black are identical.
This pattern of thinking is quite common in trading as well. Let me give you two examples.
Have you ever opened a long position because a stock had many consecutive down days or vice versa? If so, you have fallen prey to the gambler’s fallacy.
Another example would be the reaction to losing or winning streaks. If you ever felt that after many consecutive wins, the chances of losing increased and you decreased your position size, you have been guilty of the gambler’s fallacy.
The odds of winning on a trade don’t magically change just because you had multiple losses or wins before this trade.
(2) Winning Streaks
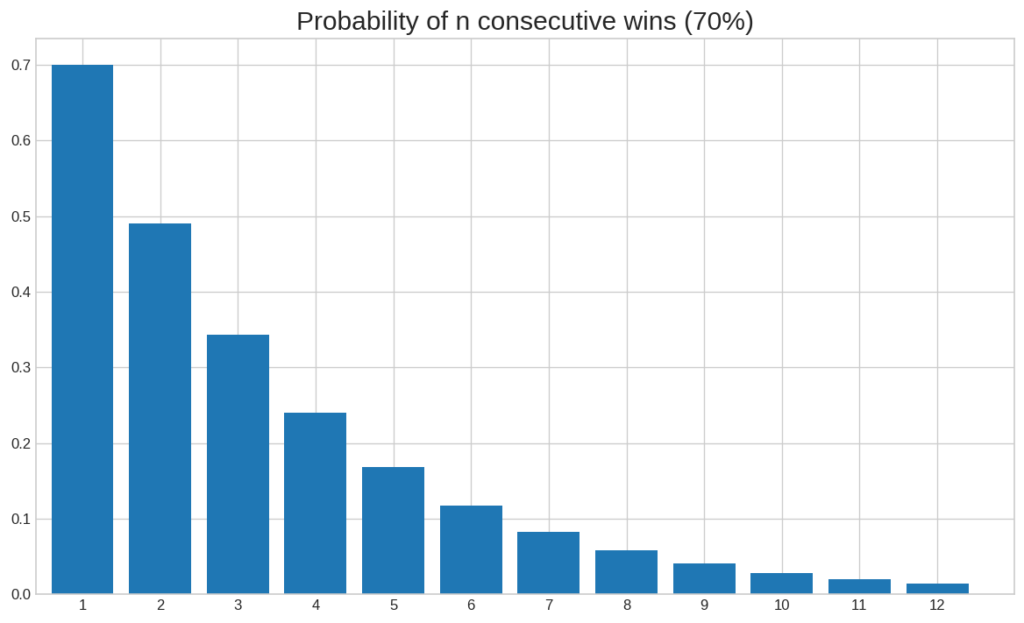
Speaking of winning streaks, if we assume that you have found a trading strategy that guarantees you a 70% chance of winning on every single trade, what do you think the odds of winning 10 times in a row are?
The answer is under 3%.
In fact, even the probability that you will have 2 consecutive wins with this strategy is under 50%. This means that it is less likely that you will have 2 consecutive winners than that you won’t.
And remember, this is with a strategy that guarantees you a 70% chance of success on each trade. Most strategies won’t have nearly as good odds.
Here is a diagram that shows the probability of different-sized winning streaks for this strategy.
To calculate the probability of n consecutive wins, you simply have to take the estimated odds of your trading strategy to the power of n. Note that this assumes that your trades are independent of each other and the probability of winning is constant. Whether these assumptions are realistic is a topic for a different article.
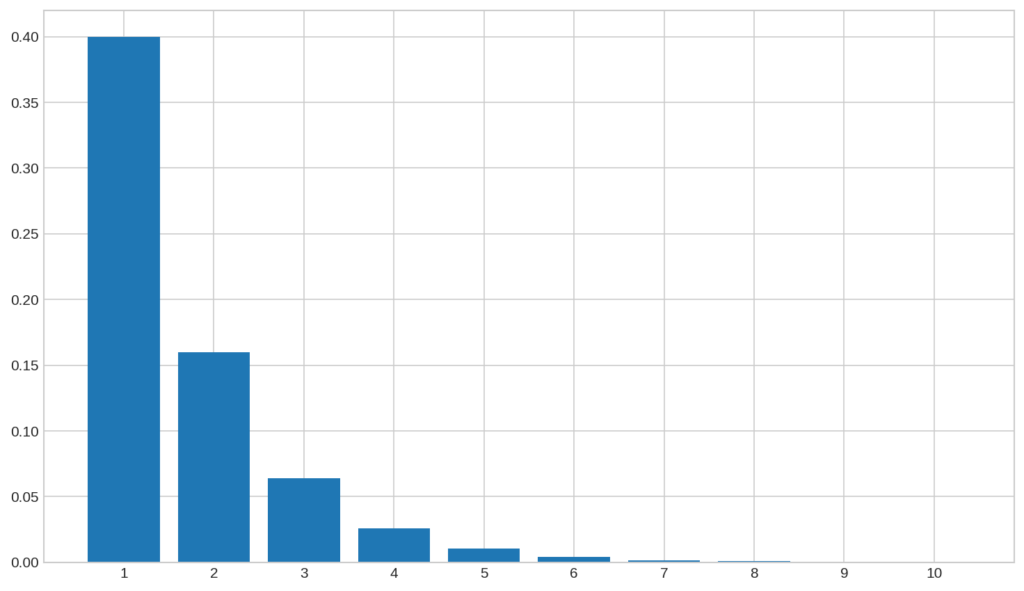
If we take a look at the odds of losing streaks, we get a similar picture. Here is a diagram that shows the probabilities of multiple consecutive losses with a trading strategy that has a 40% chance of losing on any single trade.
As you can see, with a 40% chance of losing, it is extremely unlikely that you will have more than a handful of losses in a row.
So what can we learn from this?
Firstly, no matter how good your strategy is, losses do happen. You can’t win all your trades. Therefore, you have to implement solid risk management practices and keep the size of your losses under control.
Next up, the odds of having many losses or wins in a row is quite low. So if you often have more than 10 major consecutive losses, you should seriously start doubting the quality of your trading strategy.
But always remember, even though the probability of winning 10 trades in a row is very low, the probability of winning on any single trade is not lower just because you won on the last 10 trades.
(3) Confirmation Bias
Next up, let’s take a look at our next cognitive bias, namely the confirmation bias. Confirmation bias is the tendency to seek out information that confirms your preexisting beliefs. This is a bias that without a doubt, the vast majority of traders have been guilty of.
After opening a trade, it is only natural to continually seek out information that confirms your trade idea. You might look at dozens of indicators and social media posts and only focus on those that confirm your beliefs. Finding something that agrees with you is a good feeling and certainly can boost your confidence in that position. The problem is that by doing this, you often ignore signs that your trade wasn’t the best idea and something might be wrong. Instead, you convince yourself more and more that everything is fine. By searching Twitter for a ticker symbol, you are almost guaranteed to find at least a few people that have the same market assumption as you.
One way to avoid confirmation bias in trading is by having a clear set of indicators and rules to follow for your trades. If you have such a clear set of rules and indicators, there is no need to go look for any other confirming signs. Furthermore, it is best to avoid social media as a trade decision making guide.
(4) Law of Small Numbers
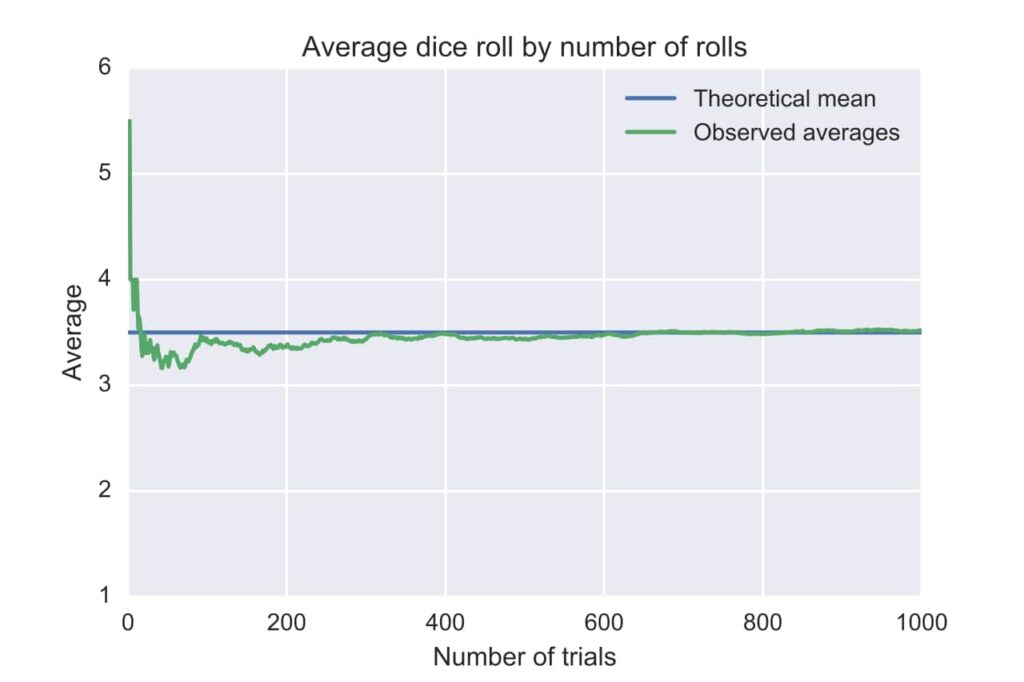
That said, let’s move on to our next fallacy. The next fallacy is the law of small numbers. You might have heard about the law of large numbers that states that the average of growing sample sizes converge to the actual mean of the total population.
Here is a graph that shows this convergence on the example of a dice roll.
This is a very powerful rule in probability theory that allows you to estimate a population’s parameters with large enough samples. But as the name implies, this only works for big sample sizes. This is where the fallacy of the law of small numbers comes into play. Most people intuitively use the law of large numbers incorrectly, namely with way too small sample sizes.
Let me give you an example.
Have you ever tried a trading strategy for a handful of trades and then concluded that it doesn’t work. If so, you have been guilty of using the law of small numbers. A few trades is not a big enough sample size to give you any significant information about the quality of a trading strategy.
Let me tell you how you can avoid the law of small numbers by showing you how to efficiently test the effectiveness of a trading system:
The goal is to use this trading system for at least 20 trades. It might seem scary to use a new trading system for over 20 trades when you have no idea how good or bad it might perform. Therefore, you should trim down your risk to a level so that you could easily afford to lose on all of these 20 trades. Your goal with these trades is not to make money, but to test out a given strategy.
When making these 20 trades, try to be as mechanical as possible. Create clear rules for every market scenario imaginable and follow these rules on every trade. If you don’t have a clear set of rules to follow, you can’t reliably test your strategy since there is no strategy to test.
Furthermore, make sure to keep a detailed and thorough trade journal. After every trade, track entry price, exit price, profit potential, money at risk, time in the trade, and more. If you want a detailed guide on how to create the most effective trade journal, check out my article on the best trade journal software.
After you have followed these steps for at least 20 trades, you are ready to evaluate the strategy. Ideally, you should now have a rich collection of data on this strategy to evaluate it and make an informed decision on how effective this trading system is.
I know that this might seem like a lot of work just to test a trading system, but without having a big enough sample size, you can’t really evaluate anything.
The goal of this example was to illustrate how you can make informed decisions based on a collection of data. Besides testing a new strategy, this approach can be used for other decisions as well.
Making a decision based on one or two occurrences is like saying roulette has a 100% win rate because you won one round.
(5) Survivorship Bias
The next cognitive bias that we are gong to look at is the survivorship bias.
Wikipedia defines survivorship bias as:
“The logical error of concentrating on the people or things that made it past some selection process and overlooking those that did not, typically because of their lack of visibility.”
Let’s, once again, look at a couple of examples to better understand what this means.
If you look around, it is easy to arrive at the conclusion that most ETFs, mutual funds, and even individual stocks go up over time. But, in reality, that is an erroneous conclusion. That’s because the universe of funds and stocks that you look at is already skewed in one direction. One reason why a stock did not go up but instead fell is that it went bankrupt. And a bad performing fund usually gets closed after a few years.
In other words, only those funds survive that performed well enough. So when you say that most stocks or funds go up over time, you aren’t considering all those that didn’t survive. Therefore, the results obtained by only looking at survivors can be very flawed.
To give you some data, a Vanguard Group study recently found that a 1997 investor in a large-cap growth or value fund only stood a 22% chance of finding a fund that would survive and outperform its benchmark 15 years later. Out of the over 5000 available funds, only 54% survived of which 19% outperformed their benchmark. The reminaing funds either got merged or liquidated.
The problem of only considering a universe of investments that survived a certain selection process is especially common when backtesting and analyzing trading strategies on historical data.
But also when analyzing success stories outside of trading, survivorship bias can be a big problem. The results of looking at shared traits of highly successful people doesn’t actually yield very significant results. Typically many unsuccessful people also share these traits but they weren’t considered in such a study which can dramatically skew the results.
Often successful people succeed in spite of certain traits, not because of them.
The phrase that history is written by winners very much also applies to business and financial markets.
In general, when looking at and analyzing investments, make sure to think about what you can’t see. Is there a seemingly invisible filter that you are missing? If so, your results can be vastly skewed in an unwanted direction.
(6) Correlation does not imply Causation
This brings us to our next common fallacy, namely mistaking correlation for causation. Correlation does not imply causation, but sadly it is often treated as if it does. There are different types of this fallacy. I will now cover 3 of the most prominent causation fallacies.
The first is reverse causation. An easy example of this is the correlation between rainy days and the usage of umbrellas. When it rains, people tend to use umbrellas much more. Does that mean that using umbrellas causes it to rain?
Of course not, it’s the other way around.
This might seem like an obvious mistake, but often things aren’t as clear. If, for instance, stock A and B are heavily correlated, does that mean that an up move in A’s price causes a rection in B’s price or the other way around?
Another causation bias is neglecting the fact that a third variable might be the cause of two correlated variables. For example, two oil stocks might be highly correlated. But this doesn’t mean that a move in one of the stocks causes a move in the other stock. Instead, a third variable, namely the price of oil might be the cause for the moves in both of these stocks.
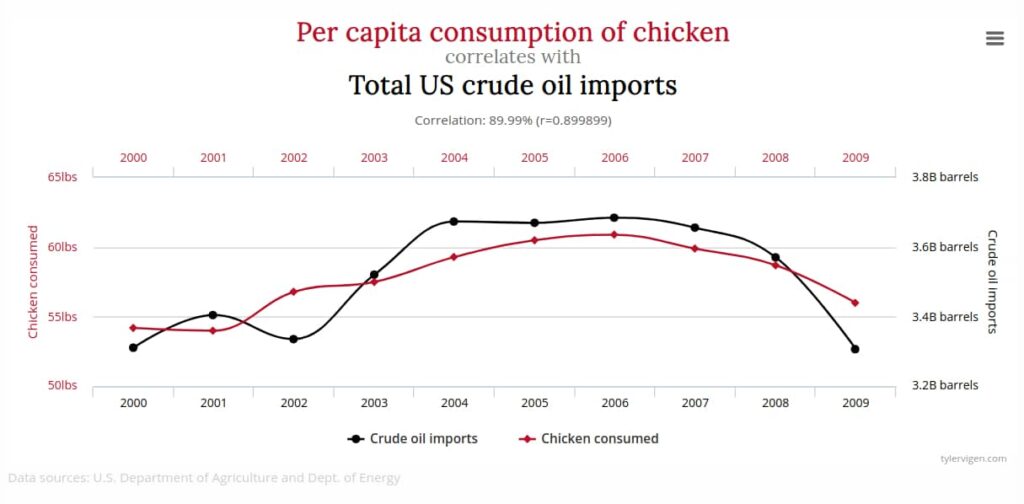
Last but not least, two variables can also be correlated without having any causal link. In fact, if you have a big enough set of data, you are almost guaranteed to find some variables that are correlated purely by chance. One example of such a coincidental correlation is the correlation between the per capita consumption of chicken and US crude oil imports. These two variables have a historic correlation of almost 90% over about 10 years. Nevertheless, I wouldn’t use chicken consumption data to try to predict US crude oil imports.
There are countless similar examples of seemingly nonsensical correlations. So going forward, never assume that correlation means causation. Proving correlation is very straightforward, but proving causation is a totally different story.
(7) Hindsight Bias
With that being said, let’s move on to the next cognitive bias, namely hindsight bias. Hindsight bias is the tendency of overstating the odds of an event that has already happened. Here is a great quote from Nobel prize-winning Daniel Kahneman about hindsight bias:
“A stupid decision that works out well becomes a brilliant decision in hindsight.“
— Daniel Kahneman
In my opinion, hindsight bias is especially common amongst traders. Way too many traders evaluate the quality of their trades based on their outcome. This is a very flawed way of evaluating your trades. A trade that has a 70% chance of making $200 and a 30% chance of losing $100 is without a doubt a great trade, no matter its outcome. Even such a trade won’t work out 3 out of 10 times, but that doesn’t make it a bad trade. Sadly, this is how many traders evaluate their trades.
Hindsight bias is also one reason why technical analysis seems so attractive. Finding chart patterns on historical charts is very easy, but without the benefit of hindsight things aren’t nearly as easy.
If you ever felt that a past price move seemed so obvious, you have fallen prey to the hindsight bias.
To avoid hindsight bias, you need some way of evaluating your trades not based on their outcome. Instead, you should focus on the quality of your decisions along the way. Did you have a clear trade plan and strategy? If so, did you follow it? If not, why not and what could you do better next time?
In general, it is best to have a consistent way of evaluating your trades that is not affected by the outcome of your trades.
(8) Recency Bias
Another common bias is the recency bias. Recency bias the illogical way of putting more weight and importance to recent events compared to historical ones. This can easily be observed by looking at the cyclical nature of markets. The longer a bull market is, the more and more people forget that prices don’t only go up. Thus, investors pay less and less attention to their risk even though it should be the other way around since the further prices rise, the more they can fall.
The same is the case directly after market crashes. This is when people typically overmanage their risk because they overestimate the odds of future drops. This can be a great time to sell overpriced insurance products such as options and volatility.
(9) Attribution Bias
A different bias that can be observed in the trading news business is the attribution bias. The attribution bias is the bias of constantly trying to assign some reason to an event, even if your reason has nothing to do with reality. Financial news companies are in the business of satisfying this bias. They seem to have an explanation for every single price move even if their explanations sometimes are contradictory.
Sometimes, you can’t break down a price move into a simple cause and effect relationship. But this doesn’t stop us from trying. The problem is that humans are very good at finding an explanation for almost anything even if the explanation doesn’t make sense. Basing trades on these explanations can do more harm than good.
So make sure to be careful when looking at the reasons that financial news organizations assign to certain price moves.
The best explanation for an up move will always be that there simply are more buyers than sellers.
(10) Sunk Cost Fallacy
Last but not least, let’s briefly look at the sunk cost fallacy. If you ever have held on to a position far longer than you should have, you have been guilty of this fallacy. The sunk cost fallacy is the tendency to refuse to stop an action because you have already sacrificed a good amount of money and/or time into it. Sometimes, it is best to just cut your loss than to further waste money and time on a project or trade. Sunk costs should not be a reason for you to continue staying in a trade.
If you wouldn’t open your trade at its current price level, you should not stay in it, regardless of how much you already have lost.
One way of combating the sunk cost fallacy is by having a clear trade plan with clearly defined exit points before you enter a trade.
How to Avoid Cognitive Biases in Trading
We have now covered a wide variety of different cognitive biases that can dramatically impact your trading and decision making in general. Let us now briefly look at how you can avoid these biases.
First and foremost, it is already a good step in the right direction to be aware that these biases exist. But sadly, simply being aware isn’t enough to completely avoid them. In fact, it is almost impossible to fully eliminate these biases from your life since they are so deeply ingrained in your human psychology. That said, you can definitely do things that can reduce the frequency of them and thereby improve the quality of your decisions.
One thing that can dramatically increase the likelihood of using a cognitive bias is trying to make decisions under time pressure. So avoiding time pressure is another step in the right direction. One way of avoiding time pressure in trading is by preparing beforehand. Instead of trying to improvise and rely on your intuition, always have a clear trade plan before you open a trade. The trade plan should have all the information you need to mechanically carry out your entire trade.
I highly recommend checking out my trade entry and exit guide in which I breakdown how to create an effective trade plan.
Besides having a trade plan, a good trade journal is another way for you to improve upon your decision making and trading.
Otherwise, try to actively monitor yourself for these cognitive biases. Especially in situations where the likelihood of a bias is high, step back and rethink the entire situation from another perspective.
Furthermore, avoid making important decisions when you are in a bad mood or not fully focused due to a lack of sleep, for instance.


