Linux process management is necessary in server administration if you want to have system that is both healthy and well-tuned.
In server administration, it is very important to understand
how running processes work in detail, from high load to slow response
time processes. There comes a time when your server may start to become
so slow or fail to respond, and as a consequence, it will require
immediate attention.
When is is the time to kill a process or renice it, and how
do we monitor the currently running processes and how these processes
affect the system load? Let’s see how Linux process management will help
us tune the system.
Process Types
Before we start talking about Linux process management, we
should review process types. These are the common types of processes you
will see:
- Parent process executes the
fork()system call. The process that invoked fork is the parent process. Every process except process 0 has one parent process. - Child process is created by the parent process.
- Orphan process is a process whose parent process has finished or terminated, though it remains running itself.
- Daemon process is usually created by a process forking a child process and then exiting. The parent process of a daemon is often, but not always, the init process.
- Zombie process has completed execution but still has an entry in the process table. This entry is still needed to allow the parent process to read its child’s exit status.
The difference between orphan process and zombie process is
that orphan process is still executing, but its parent process has died.
They do not become zombie processes; instead, they are adopted by init.
Tuning Performance With Memory Management
Memory usage always critical to the life cycle of a system,
and if you are maintaining your server or troubleshooting a particular
service or application, you will always need to remember that the use of
memory is a critical resource to your system.
The first command that we will use in Linux process management is a free command:
$ free –m.
The
–m option shows the values in megabytes: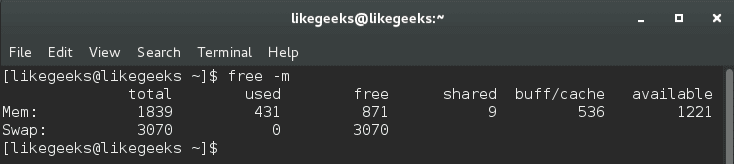
Our main concern is in buff/cache.
The importance of this part is based on the fact that it
accounts for the associated buffers and caches to illustrate what memory
is currently used and reserved. The first value indicates how much
memory is being used; the second value tells us how much memory is
available to our applications
This means 536 megabytes are used while 1221 megabytes are available.
The second line is about swapping. Swapping typically occurs
when memory usage is impacting performance. As we can see from the
previous example, the first value tells us that there is a total amount
of system swap set at 3070 megabytes, with the second value indicating
how much swap is being used 0 and the third value showing the amount of
swap that is still available to the system as a whole 3070 megabyte.
We can say from the above values that this is a healthy
system and no swap used, so while we are talking about swap, let’s
discover what the proc directory can tell us about swap.
$ cat /proc/swaps:
This shows the total and used swap size.
$ cat /proc/sys/vm/swappiness:
This command shows a value from 0 to 100. This numeric
percent implies that if your system has a value of 30 like ours, it will
begin to use swap memory at 70 percent occupation of RAM.
Notice: The default value for all Linux systems for this
value is between 30 and 60, and you can modify it with another value
between 0 and 100 with
$ echo 50 > /proc/sys/vm/swappiness or using the sysctl command with $ sudo sysctl -w vm.swappiness=50.
Changing the swap value using the above commands is not
permanent, as you reboot your system. To persist it, you have to write
it on the /etc/sysctl.conf file like this:
$ nano /etc/sysctl.conf.vm.swappiness=50:
Cool!
The level of swaps controls the tendency of the kernel to move a process out of the physical RAM onto a swap disk.
Choosing the best swap value for your system requires some
experimentation so that you can choose the best value for your server.
Managing Virtual Memory With Vmstat
Another important command used in Linux process management
is vmstat. The vmstat command is used often in Linux process management.
It gives a summary reporting associated with memory, processes, and
paging.
$ vmstat -a (-a is used to get all active and inactive processes):
This is a list of the important columns output from this command:
- si: This column shows the value swapped in from disk.
- so: This column shows the value swapped out to disk.
- bi: This column shows the value sent to block devices.
- bo: This column shows the value received from block devices.
- us: This column shows the user time.
- sy: This column shows the system time.
- id: This column shows the idle time.
Our main concern about si and co columns is where the si column shows page-ins while the so column provides page-outs.
A better way to look at this is by viewing the output with a delay option like this:
$ vmstat 2 5:
2 is the delay in seconds and 5 is the number of times
vmstat is called. It shows five updates of the command and all data is
presented in kilobytes.
Page-in (si) is generally expected when you have started an application and the information is paged-in. Page-out (so) also happens, and this is particularly so during periods when the kernel is freeing up memory.
Checking the System Load With the Top Command
In Linux process management, the top command gives a lot of
information related to tasks associated with the kernel. The display is a
real-time data and the highest load factors are expressed as a
percentage of CPU or memory. However, it is important to realize that
the top may take these values above the expected percentile range. This
is because all individual cores are expressed as a percentage and
multiple instances of these cores are totaled.
For example, a dual core system may have the first core at
40 percent and the second core at 70 percent. In this case, the top may
show a combined result of 110 percent, but you will not know the
individual values for each core.
$ top -c:
We use
-c to show the command line or the executable path behind that process.
The top command refreshes the data automatically; however, try to observe it for a few minutes before making any decisions.
Keep in mind that certain processes are spawned. Known as
child-processes, they will have a tendency to be displayed individually
like HTTPD and PHP-fpm.
A series of child processes can be seen using a significant amount of RAM.
The results provided by top should not be the only evidence you will want to review before making a final action.
Monitoring Disk I/O With Iotop
The system can begin to slow down as a result of heavy disk
I/O activities, so it is important to monitor disk I/O activities. That
means you need to figure out which processes or users cause this disk
activity.
The
iotop command in Linux process management helps us to monitor disk I/O in real-time. You can install it if you don’t have it.
Running
$ yum install iotop without any options will result in a list of all existing processes regardless of their disk I/O activities, so if you want iotop to only list processes that cause to disk I/O activity, you should use -o.$ iotop -o:
The
iotop command displays a list of all
processes and threads and a measurement of disk activity (total disk
read and actual disk read) so you can quickly identify what is impacting
any current I/O activity across the system.Checking Processes With the Ps Command
We’ve talked about ps command before on a previous post and
how to order the processes by memory usage and CPU usage, so I
recommend you to review this post about basic Linux commands.
Checking Performance With Iostat and Lsof
iostat command gives you a CPU utilization report; it can be used with –c option to display the CPU utilization report.$ iostat -c:
The output result is easy to understand, but if the system is getting busy, you will see an increase in %iowait, which is used to report on an increase in waiting time for any I/O requests to be completed.
From this command, you can check the read and write
operations so you should have a solid knowledge of what is hanging your
disk and take the right decision.
Additionally, the
lsof command is used to list the open files:
It will show you which command are using the file, the process ID, the user, and the name of the file that is open.
Calculating the System Load
Calculating system load is very important in Linux process
management. The system load is a measure of the amount of processing for
the system which is currently performing. It is not the perfect way to
measure system performance, but it gives you some evidence.
The load is calculated like this:
Actual Load = Total Load (uptime) / Number of CPUs.
You can calculate the uptime by reviewing uptime command or top command.
$ uptime:
$ top:
The server load is expressed as a value based on 1 minute, 5 minute, and 15 minute read times.
We can see that for this system, the average load was 0.00 (at 1 minute), 0.01 (at 5 minutes), and 0.05 (at 15 minutes).
When load increases, processors are queued, and if there
are multiple processor cores, the load is evenly distributed across the
server’s cores to balance the work
The ideal load for a server is generally agreed to be set
at a value of 1. This does not mean a high load as soon as this value is
reached or exceeded, but if you do begin to see double-digit responses
for some period of time, then yes, this is a high load.
Discovering Process Ids With Pgrep and Systemctl
Besides using ps command, another way of discovering a specific process ID is to use the pgrep command
$ pgrep servicename:
This command will reveal the process ID or PID. However, by
using this approach, it is also possible that the output will provide
more than one value. So remember, if an application such as httpd or ssh
provides one or more process IDs, you can safely assume that the lowest
number (which represents the first PID generated by the system) is the
most important one. This value is known as the PPID or parent process
ID.
On the other hand, you can use systemctl command to get the main PID.
$ systemctl status <service_name.service:
There are many ways to obtain the required process ID or parent process ID.
Discussing Systemd
If we are going to talk about Linux process management, we
should take a look at systemd. The systemd is responsible for
controlling how services are managed on CentOS 7.
You can start, stop, and check the status like this:
$ systemctl status <service_name>.service
$ systemctl stop <service_name>.service
$ systemctl start <service_name>.service
Instead of using chkconfig to enable and disable a service during the boot, you can use systemctl command:
$ systemctl enable <service_name>.service
$ systemctl disable <service_name>.service
Systemd also comes with its own version of top, and in
order to view the processes that are associated with a particular
service, you can use the system-cgtop command like this:
$ systemd-cgtop:
As you can see all associated processes, path, the number
of tasks, the percentage of CPU used, memory allocation, and the
relative inputs and outputs. It works in a way similar to top.
This command can be used to output a recursive list of service content like this
$ systemd-cgls:
This command gives us very useful information that can be used to take your decision.
Nice and Renice Processes
The niceness of a process is a numeric hint to the kernel
about how the process should be treated in relation to other processes
contending for the CPU. A high nice value means a low priority for your
process so how nice you are going to be to other users, and that’s the
name come from.
The nice range is from -20 to +19.
Nice command sets the nice value for the process at
creation time, while renice command adjusts the value later and takes
process ID as a parameter.
$ nice –n 5./myscript increases the nice means lower priority by 5.
$ sudo renice -5 2213:
This command decrease the nice value means increased priority.
The owner of the process can increase its nice value (lower
priority) but cannot lower it (high priority) while root user can do
both.
Sending the Kill Signal
All we’ve discussed, Linux process management is used to
get the top running processes, which processes make high CPU load, which
one eats the memory is to send that process ID to kill command.
The process ID does have other uses, but our primary
concern is to remove a service or application causes problem by issuing a
termination signal (SIGTERM). You can review the previous post about
signal and jobs bash scripting.
$ kill process ID is
called safe kill. However, depending on your situation, a better
solution can be to force a service or application to hang up, and
thereby enable an automatic reload of the service like this: $ kill -1 process ID.
Sometimes, the safe kill and reload fail to do anything. In
that case, you can send kill signal SIGKILL by using the -9 option,
which is called forced kill:
$ kill -9 process ID.
There are no cleanup operations or safe exit with this
command and not preferred. However, you can do something more proper by
using the pkill command:
$ pkill -9 serviceName.
And you can use the pgrep command to ensure that all associated processes killed.
$ pgrep serviceName:
I hope you have a good idea about Linux process management and how to take good actions to make the system healthy.